
Monitoring LLM Activity Through Your AI Gateway: A Practical Guide
Learn how to monitor LLM activity through your AI gateway. Metrics that matter, what good observability looks like, and how to act on the data in production.

Sohrab Hosseini
Co-founder (Orq.ai)

Key Takeaways
Loss of control over LLM usage happens gradually, not suddenly but when multiple teams add different providers without a shared visibility layer.
Provider dashboards become useless beyond single-model deployments; you need gateway-level monitoring to see how requests move across your entire AI infrastructure.
Smart routing alone can reduce LLM costs by 25-70%, but only when teams have visibility into which routes and models are actually handling traffic.
Bring LLM-powered apps from prototype to production
Discover a collaborative platform where teams work side-by-side to deliver LLM apps safely.


Contrary to popular belief, losing control over LLM usage doesn’t happen in a single step. In our experience, it’s a gradual process happening in the background that teams typically aren’t aware of.
Picture this: one product team adds an OpenAI product for a chatbot. Meanwhile, another team is testing Anthropic for a support workflow and an engineer is adding a fallback model after a provider outage. Not before long, AI traffic is moving across various models and workflows all at once.
The worst part is that no one on the team has a real idea of why latency has changed or prompts are failing.
When teams get to this point, they start to really understand that provider dashboards won’t be enough anymore. That instinct is understandable, but it comes with a cost. 80% of companies exceed their AI cost forecasts by more than 25%, and less than a quarter track LLM spend by individual transaction.
A provider dashboard can show activity inside one model platform. What it can’t do is show how requests move across your full AI stack or how agentic workflows behave across multiple steps. For production AI systems, those details matter more than you think.
Instead, teams need to consider using an AI gateway. It acts as a shared control point between applications and model providers. A natural place to monitor prompts, costs, and latency.
Despite being able to keep track of all this information in one place, teams find the true value of AI gateways when they start to actually act on this information.
That's what this guide covers: what to capture, what to watch, and what to do when something changes.
Why monitor LLM activity at the gateway layer?
When your team’s AI usage starts going beyond a single model or application, LLM monitoring quickly turns into chaos.
Provider dashboards might get the job done at a small scale. You can see how many tokens went through one account and which model was used. That’s an ideal world that doesn’t match the reality of production AI systems.
Agents might have to make several model calls before producing one user-facing answer and workflows have to call different models for different tasks. A fast model for classification, a stronger model for reasoning, and an embedding model for retrieval.
An AI gateway puts teams in a much better position. It sees traffic before it’s distributed across providers. That way it’s easier to monitor LLM activity at the point where engineering and cost control intersect.
If spend increases suddenly, the gateway can show what the cause was. User demand, longer prompts, or repeated tries. If latency gets worse, it can show whether the issue comes from one provider, one region, one model variant or one workflow.
This isn’t context you can easily reconstruct later from disconnected logs.
Keep in mind the goal isn’t to replace application monitoring or evaluations. Those still matter. Application monitoring shows what happened inside the product experience. Evaluations show whether outputs meet quality expectations. Gateway monitoring shows what happened at the model boundary.
And that boundary is where a lot of production AI problems first become visible. The market for LLM observability platforms is projected to grow from about $2.7 billion in 2026 to over $9.2 billion by 2030.
Monitoring is becoming standard infrastructure rather than a nice to have.
What gateway monitoring should capture
A useful AI gateway should capture more than just request counts.
Basic traffic volume has its use. But when it comes to explaining why costs changed or why a workflow slowdown, it won’t do much good in that department.
Good gateway monitors cover six main areas.
1: Cost and token usage
Cost monitoring needs to show how much each AI workflow is spending and what’s driving that spend. The bare minimum is getting visibility into input tokens, output tokens, and total requests.
A more useful view would go a lot further than that.
You should be able to see if spend is concentrated in one feature, one API key, or one route.
On average, around 35% of AI API costs go completely unattributed in teams without request-level tagging, which makes budget planning closer to guesswork than planning.
On the surface, you might initially think a support assistant is fairly cheap. Dig deeper and you’ll find that costs add up fast when it’s running retrieval and summarization on every conversation.
Good gateway monitors should make those patterns very clear before the finance teams end up finding them in the monthly invoice.
2: Usage by model, provider, key, user, team, workflow
Usage data needs attribution. Just seeing that tokens increased won’t do much good. You need to know where they came from.
A useful gateway would show activity by:
Model
Provider
API key
User
Team
Application
Workflow
Environment
You can then start to understand which product area is driving traffic and which internal team is testing models. For example, if one workflow starts sending unusually large prompts, the gateway should indicate the responsible application and route.
3: Route decisions
If your gateway includes routing, then knowing the reason behind why each request went where it did is a necessity.
Route monitoring needs to capture the selected model or latency condition that influenced the decision. We find this to be incredibly important when teams use dynamic or smart routing instead of static model assignment.
Otherwise, routing is a black-box mystery your team won’t be able to solve. Costs fall. But no one knows if the quality remained stable. Latency improves. But no one knows which workflows shifted.
Routing decisions need to be reviewable. Not just automatic.
4: Quality and evaluation signals
You can see what happened to a request through a gateway monitor. But quality needs additional context.
Your gateway monitor should capture signals that connect production traffic to evaluation workflows. Think in the lines of:
Eval scores
Human feedback
User ratings
Refusal rates
Hallucination reports
Regression test results
You don’t want to just log results. You want to know if routing and model changes are actually improving the system or secretly making it worse. We’ve worked with plenty of teams that had healthy infrastructure metrics but degraded output quality.
Connecting gateway traces to evaluations turns production failures into test cases. A bad answer shouldn’t disappear into a support ticket. It should become part of the evaluation set linked to the prompt or model that caused the issue in the first place.
5: Guardrail and policy events
Knowing whether a request succeeds isn’t sufficient. You need to know when controls are triggered.
Take an instance where repeated sensitive-data detections in one workflow indicate that prompts need redesigning. Frequent blocked requests from one integration tell you that a product feature is exposing the wrong input field. A sudden increase in policy events after a release could suggest a change in user behavior or even application logic.
Gateway-level policy monitoring gives governance teams something concrete to work with. Instead of relying on written rules alone, you can see how controls behave in production.
Gateway-level vs. application-level monitoring
Gateway-level monitoring and application-level monitoring answer different questions.
Gateway monitoring shows what happened at the model boundary. It captures the request as it moves from the application into the AI infrastructure layer then out toward a model provider or routed destination. You get a better understanding of model usage and provider performance.
Application monitoring shows what happens inside the product experience. It connects AI behavior to user actions or task completion. Product and engineering teams understand whether the AI feature actually worked for the user.
Both matter. One without the other leaves gaps.
Here’s how to split the responsibilities:
Monitoring layer | What it tells you | Typical questions it answers |
Gateway-level monitoring | What happened to the LLM request | Which model handled the request? What did it cost? Did routing, retry or fallback logic run? |
Application-level monitoring | What happened in the user workflow | Did the user complete the task? Did the AI response help? Did the session continue or fail? |
Evaluation monitoring | Whether the output met quality standards | Was the answer accurate, safe, grounded and formatted correctly? |
APM/infrastructure monitoring | Whether the surrounding system stayed healthy | Did services, databases, queues or APIs slow down? |
Core metrics to track at the gateway
Gateway monitoring is best used when you have metrics that are simple enough to review regularly but detailed enough to explain what changed. You don’t want to collect every possible signal.
Instead, try to track the few metrics that show if LLM traffic is still reliable and useful in production.
With Enterprise GenAI spending reaching $37 billion in 2025 (up from $11.5 billion in 2024), you’ll need to know exactly what metrics to track:
Total requests: Shows overall AI traffic volume across applications, environments and workflows.
Tokens in/out: Tracks prompt size and response length, which often explain cost increases better than request volume alone.
Cost by model, provider and workflow: Reveals where spend is concentrated and whether specific routes, features or teams are driving the bill.
p50, p95 and p99 latency: Shows typical response speed as well as the slower tail latencies that usually affect user experience most.
Error and timeout rate: Highlights provider failures, network issues, overloaded routes or workflows that regularly exceed configured limits.
Retry and fallback rate: Shows how often the system needs a second attempt or backup model to complete a request.
Route distribution: Reveals which models and providers handle traffic, and whether routing rules behave as expected.
Evaluation or quality score: Connects production traffic to output quality, so teams can see whether model changes improve or weaken responses.
Policy and guardrail events: Tracks blocked prompts, sensitive-data detections, moderation events and other governance controls.
It’s best to view these metrics altogether rather than individually. A cost spike could come from higher usage or a route change while a latency issue can come from one model or one workflow.
How to set up monitoring on AI gateways
Good gateway monitoring starts with structure. Before dashboards and alerts become useful, AI traffic needs to pass through a consistent layer and connect back to the systems that measure quality and reliability.
1. Centralize traffic through the gateway
Start by routing model calls through the gateway instead of sending requests directly from each application to each provider. You get one control point OpenAI, Anthropic, Gemini, Mistral, and other self-hosted models.
Otherwise you end up with usage data scattered across application logs and finance reports. Every answer takes longer to piece together whenever your team tries to investigate issues.
2. Attach metadata to every request
Every request should include enough context to make the trace useful at a later date. At minimum you want to attach metadata like:
Application
Environment
User
Team
Project
Workflow
Customer account
API key
This way, you turn raw data into attributable usage. You won’t just see that token volume increased. You’ll know what workflow caused the increase and which team owns it.
3. Define routes and fallback rules
Monitoring becomes more meaningful when routes have clear intent. Define which models should handle which tasks and when fallback models should run.
In a scenario where a low-risk classification task needs to route to a cheaper model, a multi-step reasoning workflow would need a stronger model and a carefully tested fallback chain. Gateway monitoring should then show whether those rules actually run as expected.
4. Enable logging and tracing
You can get surface-level details like request volume and model choice from basic logs. Traces go a lot further by showing the full path of a request including:
Prompt
Response
Selected route
Fallback attempts
Retries
Policy decisions
Cost
This is key for agentic workflows. Users could see one answer but the system probably made several model calls behind the scenes. Tracing lets you appreciate the full sequence instead of just seeing the final output.
5. Connect evals and feedback
Gateway data shows what happened. Evals and feedback show whether the output was good enough.
You need to connect production traces to evaluation workflows, human feedback, and regression tests. This lets you trace the model or prompt behind a poor response whenever it does come up.
Monitoring becomes a feedback loop. Bad outputs become test cases. Repeated failures become prompt or routing updates. Quality issues stop living only in support tickets.
6. Set budgets and alerts
Despite dashboards helping with review, alerts are what actually catch problems early. Set alerts for things like:
Sudden cost spikes
Unusual token growth
Latency increases
Provider error rates
Budget thresholds
Unexpected model usage
Bear in mind that budgets should also map to real ownership. A global monthly spend number helps finance out. But engineering needs more specific controls by project or workflow.
7. Review regularly
Monitoring shouldn’t become a dashboard nobody opens. Review gateway data on a regular cadence. Especially after model changes, product releases, or new routes.
Look for patterns. Things like routes drifting toward expensive models or eval scores dropping after a model switch.
You don’t need to have a perfect setup from the get go on day one. Start with centralized traffic and cost. Then you can start to add traces and evals as your AI stack gets more complicated.
How to act on gateway monitoring data
Monitoring only helps when teams use the data to change how the system behaves. A dashboard that shows rising cost, slower latency or more fallback calls has limited value on its own. The important question is what the team does next.
Investigate cost spikes by route, not just provider: When LLM spend increases, start by breaking the data down by workflow and token volume. A higher bill might come from more users. It could also come from longer prompts or a fallback model handling more traffic than expected. Smart routing alone can reduce LLM costs by 25 to 70% depending on workload mix by directing simpler tasks to lower-cost models without sacrificing output quality.
Use latency data to find the real bottleneck: Latency should be reviewed by model, provider, route, region and workflow. A slow experience doesn’t always mean the main model is slow.
Turn fallback patterns into reliability improvements: A rising fallback rate could signal provider instability or poor time-out settings. Use gateway monitoring to see which requests fell back, then decide to change the primary route or add another provider.
Connect quality issues to prompts, models and routes: Quality problems often hide behind successful requests. Keep track of what prompt version or model was involved when an output fails.
Governance and compliance considerations
It’s easy to forget about governance when you get caught up in the midst of all the technical considerations of an AI gateway.
Governance can’t just rely on written policies or vendor questionnaires. Production systems need evidence and your team needs to show controls behave at runtime.
Auditability: Gateway logs and traces can provide an audit trail for LLM activity across applications and workflows. Useful evidence for internal reviews and compliance reporting in regulated sectors.
Data residency and regional control: Enterprises handling public-sector use cases or sensitive customer data need to control where AI requests are processed. Gateway monitoring should show whether traffic followed the correct regional route.
Policy enforcement: Governance depends on consistent controls. If each application connects directly to model providers, then policy enforcement quickly becomes uneven across teams.
Model and provider accountability: Multi-model systems need clear visibility into provider usage. Governance teams should know which providers support which workflows and if any restricted models are being used.
EU AI Act readiness: Gateway monitoring creates clearer records of model usage and risk controls. It provides evidence for areas like logging and access control.

Source: Nemko
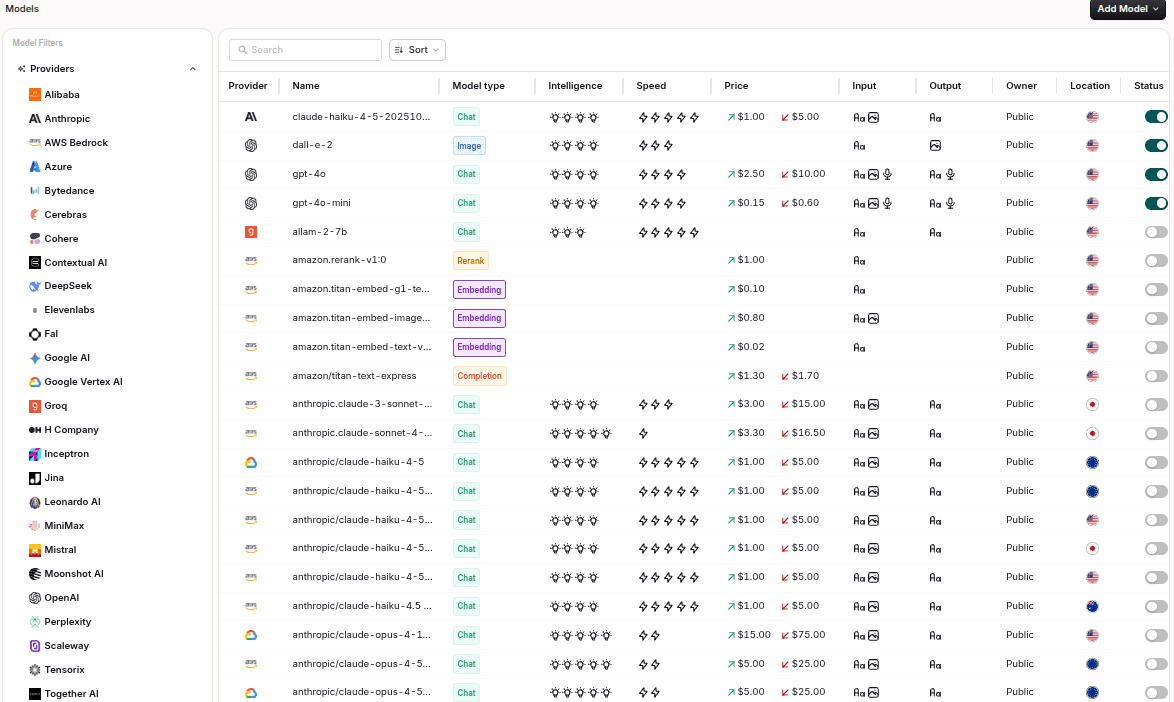
Where Orq.ai Router fits
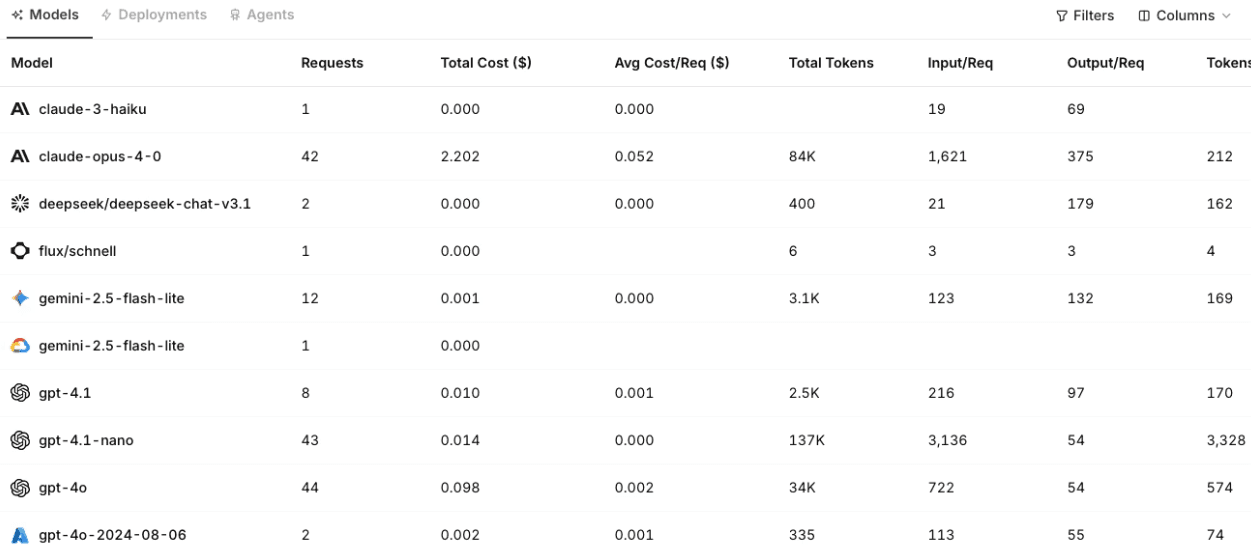
Most of the monitoring gaps described in this guide come down to the same problem: AI traffic is moving across multiple models and workflows, but there is no shared layer that sees all of it. Orq.ai Router sits at that layer.
Every request passing through the Router gets traced. The selected model, route decision, token counts, latency, cost, fallback attempts, and policy events are all captured in one place. That means when latency spikes or spend jumps, you are not piecing together disconnected logs from three provider dashboards. The gateway trace shows you exactly which route, workflow, or model caused it.
The monitoring layer connects directly to the rest of the platform. If a production trace shows a quality regression, you can link it back to the prompt version that was running at the time and push it into an eval set without leaving the platform. Route decisions are logged and reviewable, so dynamic routing never becomes a black box. You can see why a request went where it did and whether the quality tradeoff was worth it.
“The teams we talk to aren't struggling because they lack data. They're struggling because the data is everywhere and connected to nothing. That's the problem we set out to fix.” Sohrab Hosseini, Orq.ai co-founder
From visibility to control
Most teams don't lose control of their AI stack all at once. It happens gradually: a new provider added here, a workflow scaled up there, a fallback route that nobody documented. By the time it shows up as a cost spike or a latency complaint, the data to explain it is already scattered across three dashboards.
A gateway changes that dynamic. When all model traffic passes through one layer, monitoring stops being a forensic exercise and starts being something you can act on in real time. Cost attribution becomes clear. Route decisions become reviewable. Quality regressions become test cases instead of support tickets.
The goal isn't to collect more metrics. It's to build a production AI stack where the team always knows what's running, what it costs, and whether it's working.
That's what good gateway monitoring makes possible, and it's the foundation every production AI system eventually needs.
Ready to get that visibility in your own stack? Book a demo and we'll walk through what monitoring looks like for your setup.
FAQs
Do I need a separate observability tool if I have an AI gateway?
Not always. If your gateway captures prompts and quality signals, it’ll probably cover most LLM observability needs. But if you find that you need deeper application tracing or infrastructure monitoring, a dedicated observability tool can still help.
What's the most important metric to start monitoring at the gateway?
Initially you’ll want to start with cost by model or workflow. You get an immediate view of where LLM usage is concentrated. It also reveals if spend is coming from real adoption or long prompts.
How is AI gateway monitoring different from APM?
APM monitors application and infrastructure like:
Services
Databases
Queues
Errors
Response times
On the flip side, AI gateway monitoring focus on the model boundary like:
Prompts
Tokens
Providers
Routes
Fallbacks
Latency
Cost
Outputs
Policy events
Can I monitor multi-step agent activity through the gateway?
Yes, if the gateway captures traces across each model call and route decision. This lets you see the full agent path instead of only the final response shown to the user.
How does gateway monitoring help with EU AI Act compliance?
It supports traceability and logging but doesn’t make a system compliant by itself. Instead, it gives your team evidence that it can be used as a broader governance process.
How long does it take to set up a model router?
A basic setup can be quick when applications already use a centralized model access layer or OpenAI-compatible API. Production-ready routing usually takes longer because teams need to define routes and attach metadata.

Sohrab Hosseini
Co-founder (Orq.ai)
About
Sohrab is one of the two co-founders at Orq.ai. Before founding Orq.ai, Sohrab led and grew different SaaS companies as COO/CTO and as a McKinsey associate.
